Platform Product Analytics
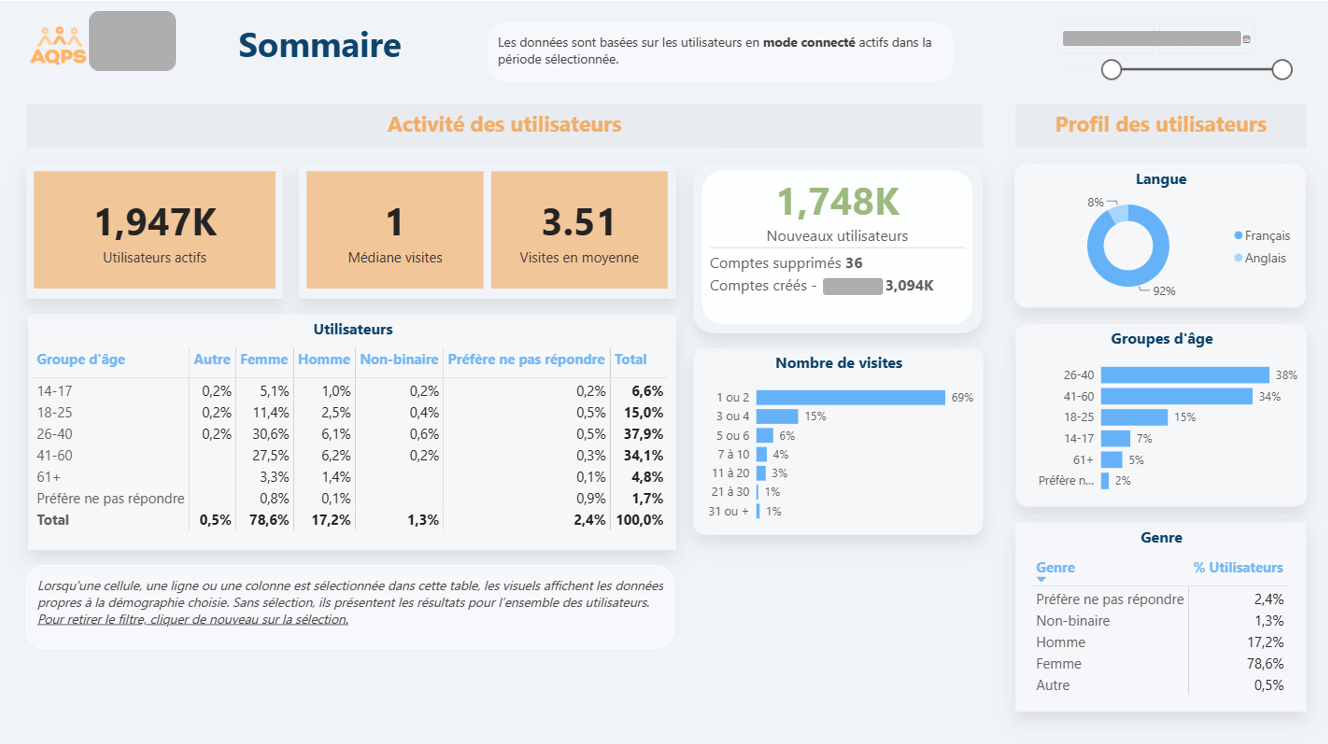 Excerpt from an executive dashboard designed to monitor platform adoption and usage across the different tools available within the platform.
Summary
I developed analytics and reporting solutions for a digital platform providing support tools and resources to its users.
This included designing a decision-oriented data model, defining KPIs, and developing two Power BI dashboards with 16 analytical pages and 50+ KPIs. I also conducted data quality validation and enhanced documentation for events, data fields, and dashboard usage.
These initiatives improved visibility into user behavior, feature adoption, and platform performance, supporting data-driven product decisions.
Key challenges
- Establishing a consistent view of usage across the platform’s different tools.
- Measuring feature adoption and user engagement through meaningful KPIs.
- Transforming operational data into decision-ready information.
- Identifying data quality issues that could impact analysis.
My role
- Analyzing platform usage data and designing a star schema data model.
- Developing Power Query transformations and DAX measures for performance monitoring.
- Defining and recommending KPIs aligned with Digital Strategy team objectives.
- Validating data quality and producing documentation on data issues, dashboard usage, events, and data fields.
- Developing Power BI dashboards to monitor platform usage and feature adoption.
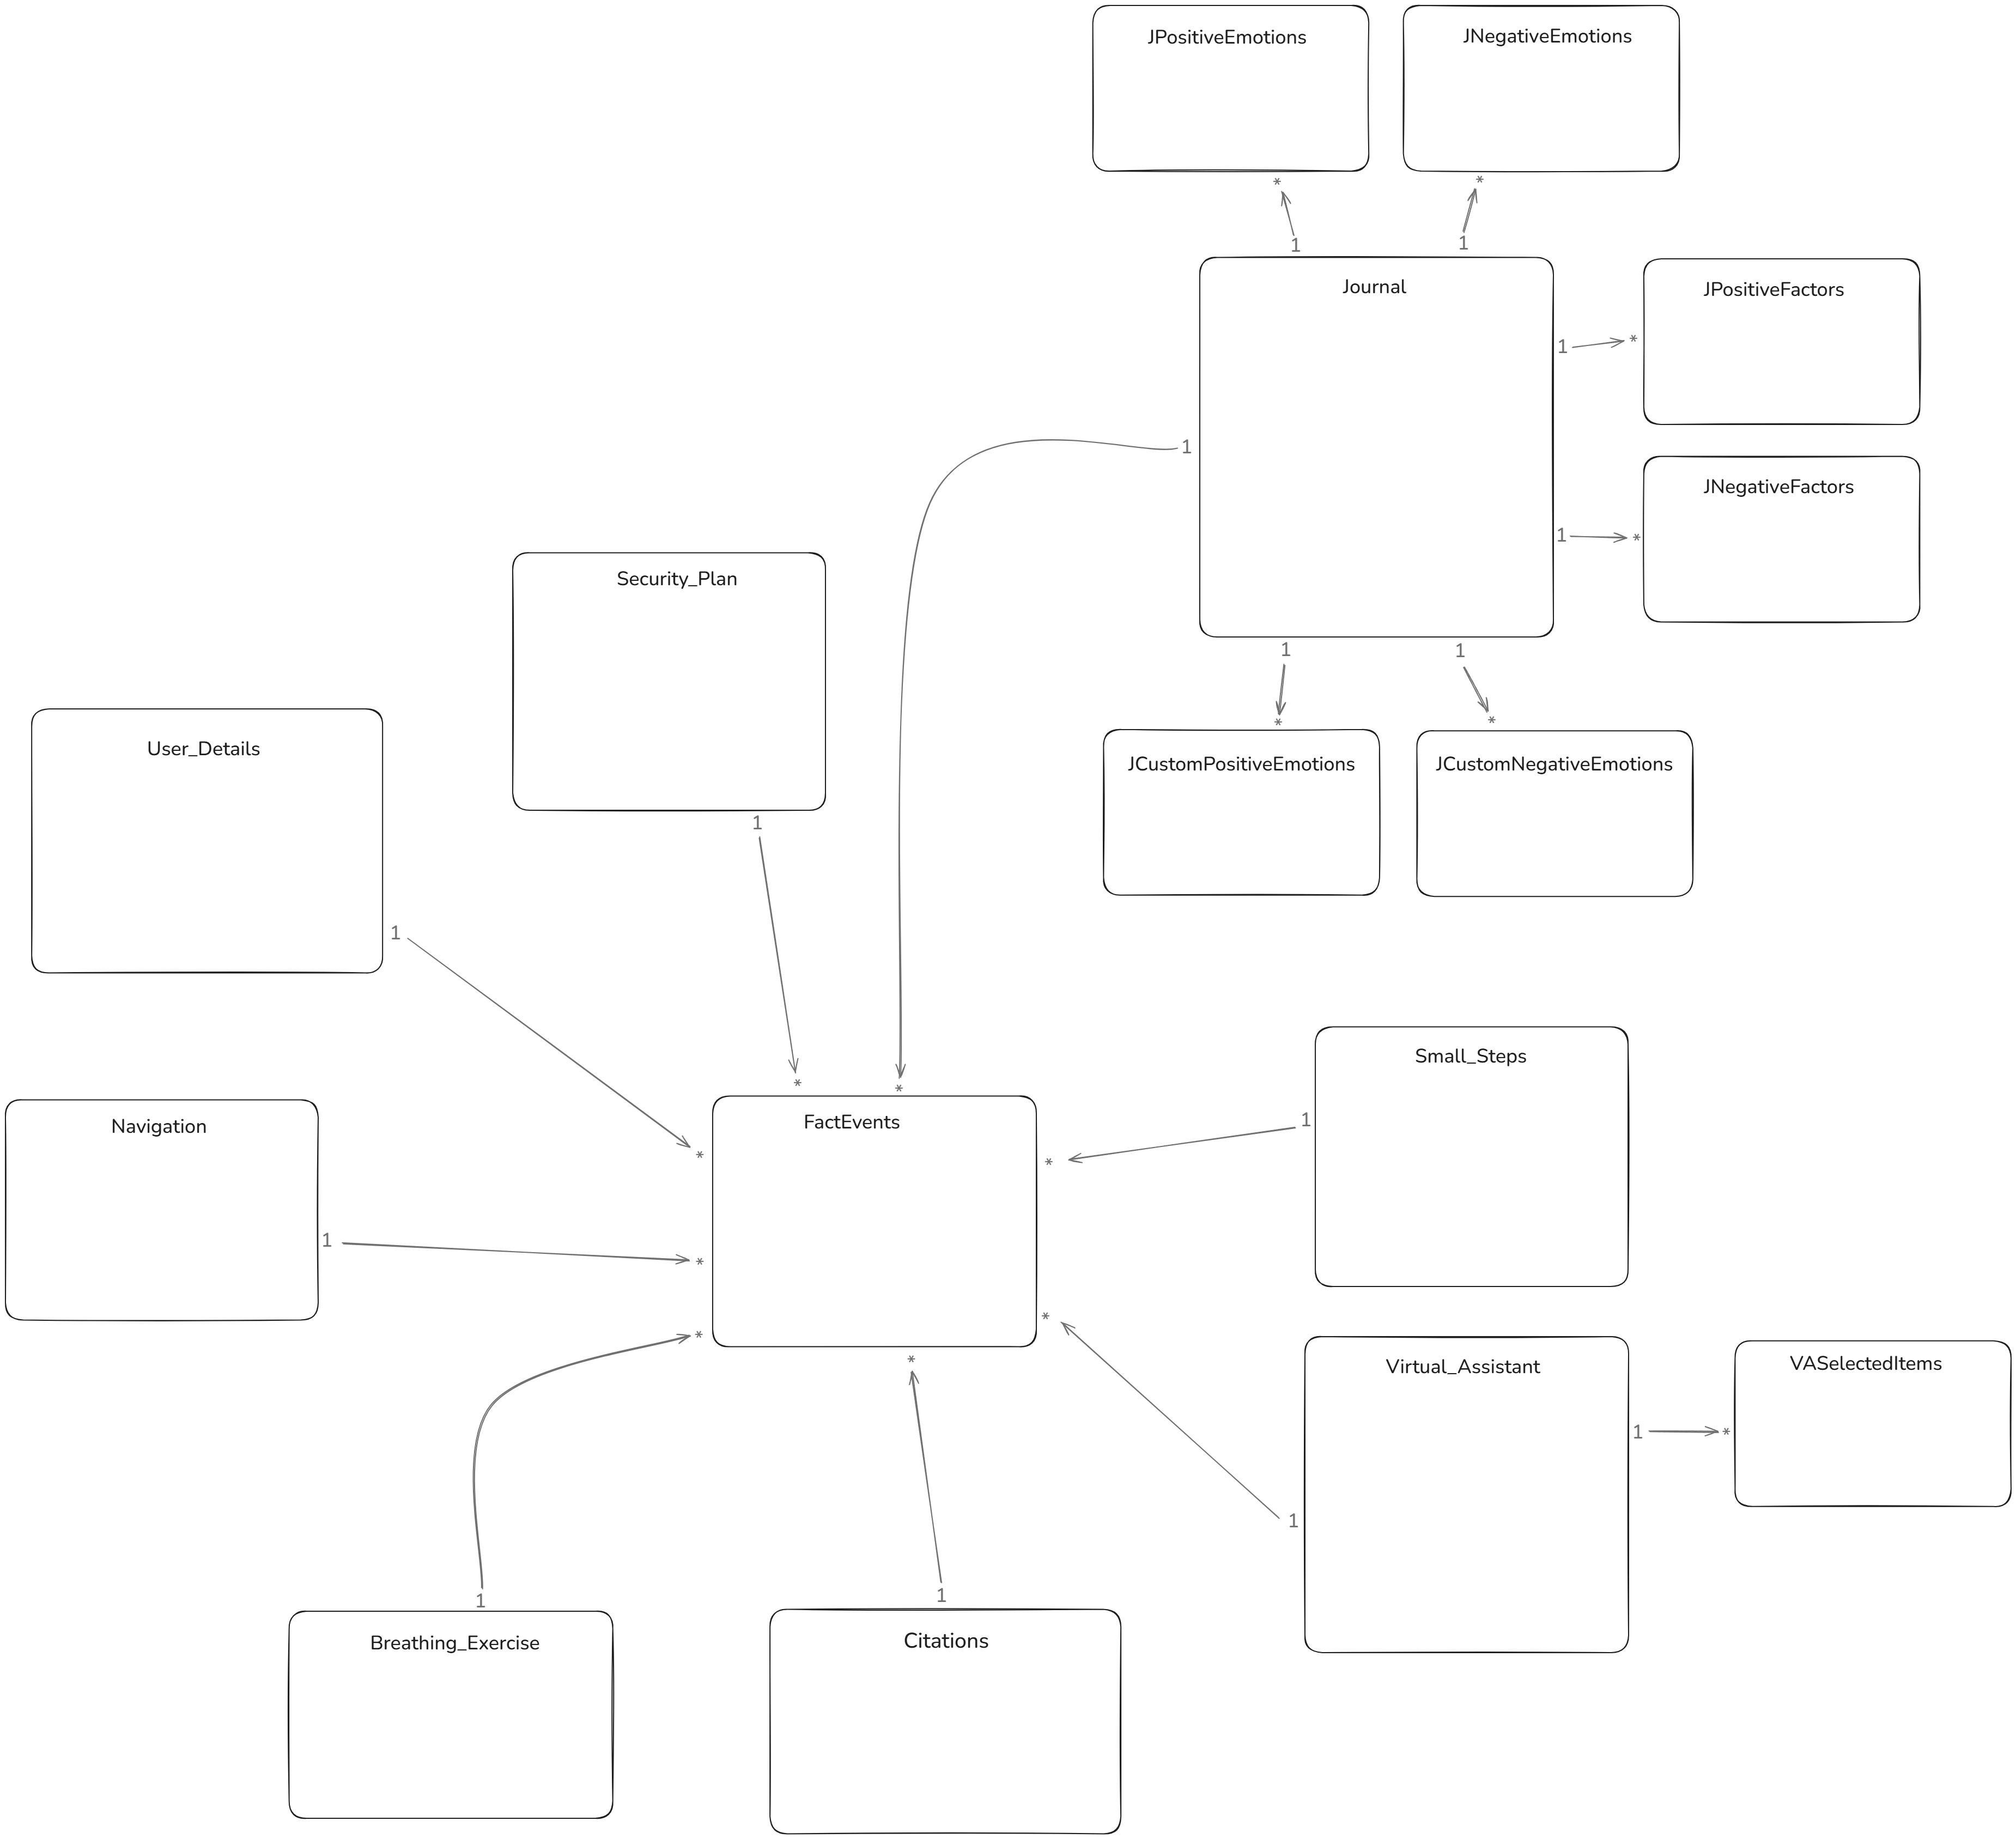 *Star schema that I developed
Solution and results
To support the organization’s analytical needs, a decision-oriented data structure was developed alongside recommendations regarding performance measurement and key performance indicators. The project resulted in the creation of two Power BI dashboards totaling 16 analytical pages and more than 50 KPIs, as well as data quality validation and the production and enhancement of documentation covering events, data fields, and dashboard usage.
These deliverables provided the Digital Strategy team with a consolidated view of platform usage, a better understanding of feature adoption, and data-driven insights to support future product decisions.
Dashboard Highlights
Dashboard 1 - Executive Overview
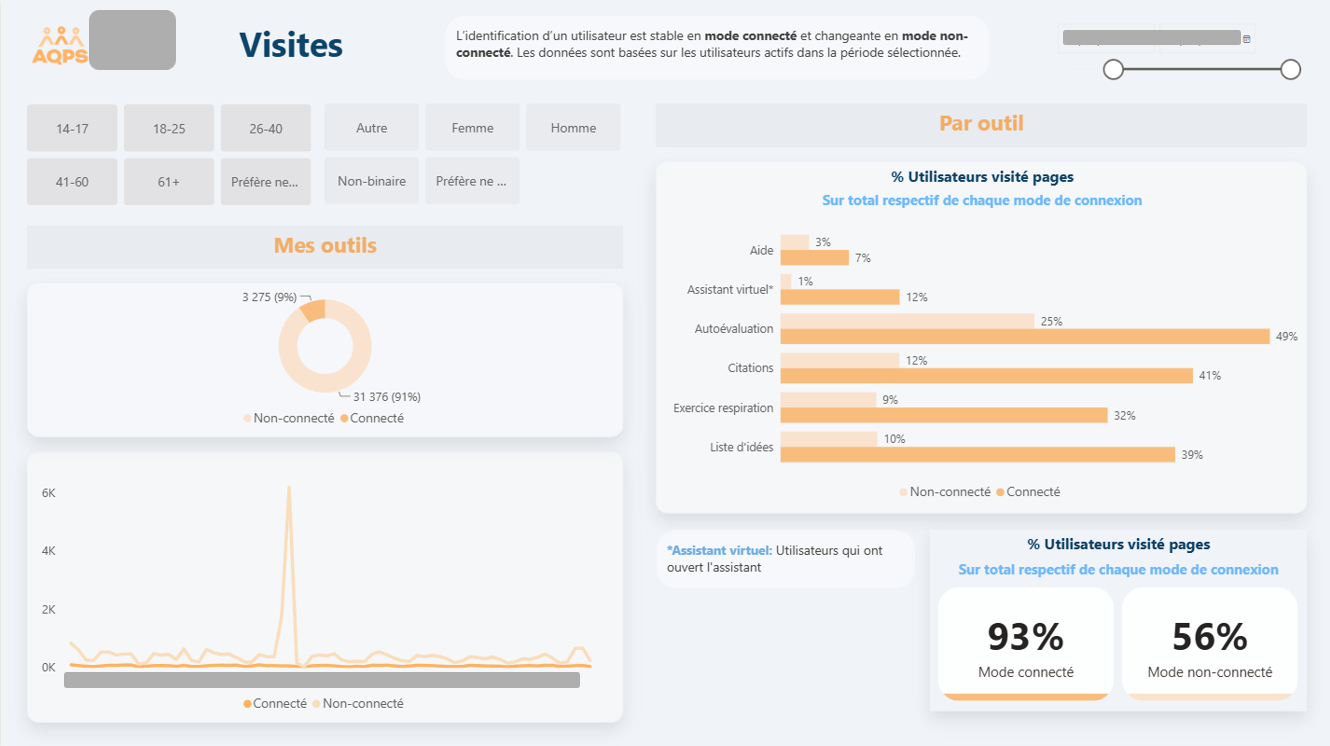 This view compares visits across the platform’s different tools and highlights behavioral differences between authenticated and non-authenticated users.
Dashboard 2 - Detailed Tool Analytics
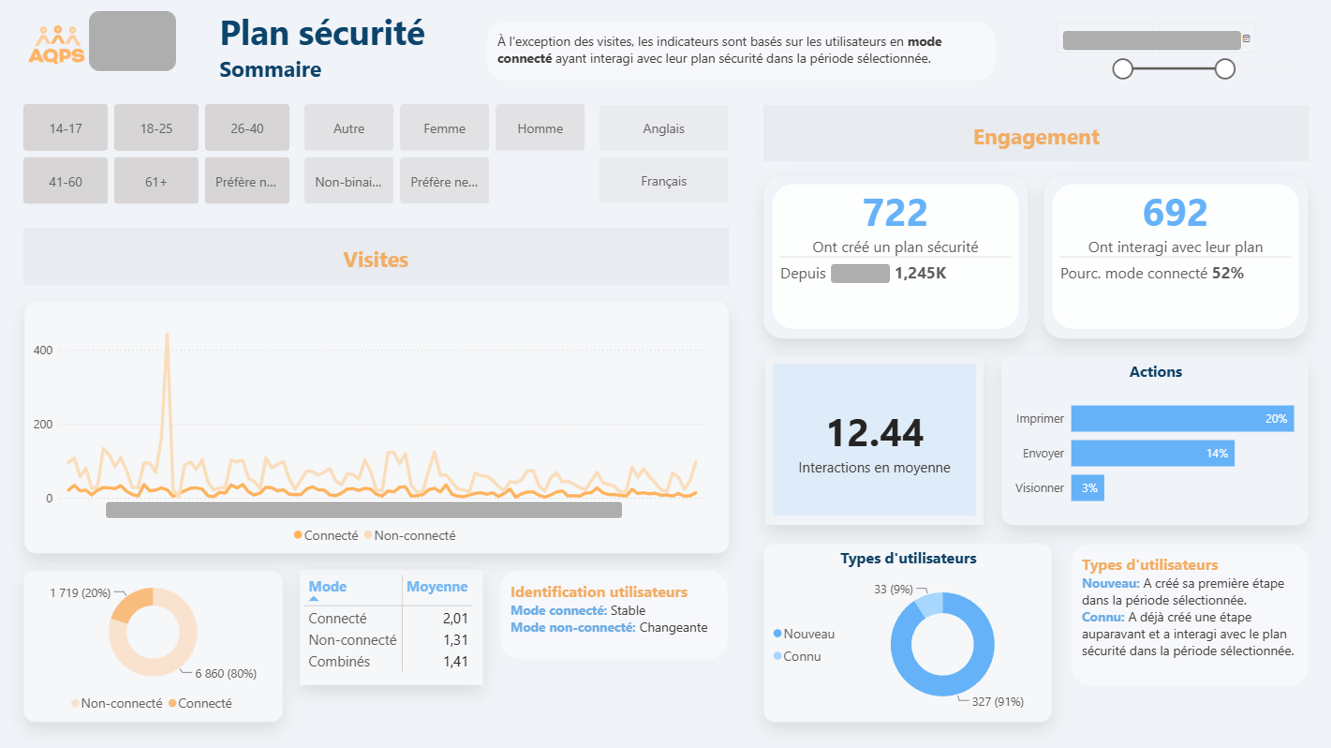 Detailed analysis of user engagement with the Safety Plan tool, including interactions, actions performed, and user profiles.
Note: The dates have been masked to protect data confidentiality. Screenshots are presented with the client’s perm
Skills applied
Power BI · KPI Metric Development · Data modeling · Data Validation · Microsoft Power BI Development