Montreal Airbnb Market Analysis
#python #pandas #tableau #personal
Summary
Working from a stakeholder-driven business scenario, I analyzed Airbnb data from Montreal to identify opportunities for hosts to improve occupancy, pricing, and visibility. Using Python, Pandas, and Tableau, I transformed raw listing and calendar data into actionable insights and recommendations tailored to different property types and neighborhoods.
Business Requirements
The analysis needed to provide:
- Year-over-year market performance
- Average Airbnb pricing
- Demand and offer by bedroom count
- Impact of the Instant Book feature
The final deliverable aimed to provide actionable recommendations to help hosts increase occupancy, optimize pricing, and strengthen their position in the local market.
Methodology
- Cleaned and validated calendar and listing datasets using Pandas.
- Standardized data formats, including currency and property attributes.
- Removed inactive listings to better represent the active market.
- Aggregated calendar data into daily booking and occupancy metrics.
- Created year-over-year booking metrics for trend analysis.
- Developed pricing, demand, and Instant Book performance indicators.
Technical Highlight: Occupancy Metric
#Aggregate availability by date
bookings1 = df1.groupby('date')['available'].agg(['sum', 'count'])

#Calculate booked listings
bookings1['sum_booked25'] = bookings1['count'] - bookings1['sum']

# Calculate availability and booking rates
bookings1['perc_avail25'] = (bookings1['sum'] / bookings1['count']) * 100

bookings1['perc_booked25'] = (bookings1['sum_booked25'] / bookings1['count']) * 100
Aggregated listing availability by date and created occupancy metrics to estimate booking demand and compare market performance year over year.
Executive Summary
- Bookings declined 15% year-over-year, driven primarily by weak Spring 2025 demand.
- Listings with Instant Book enabled achieved approximately 6% higher occupancy and 4% more reviews while maintaining similar ratings.
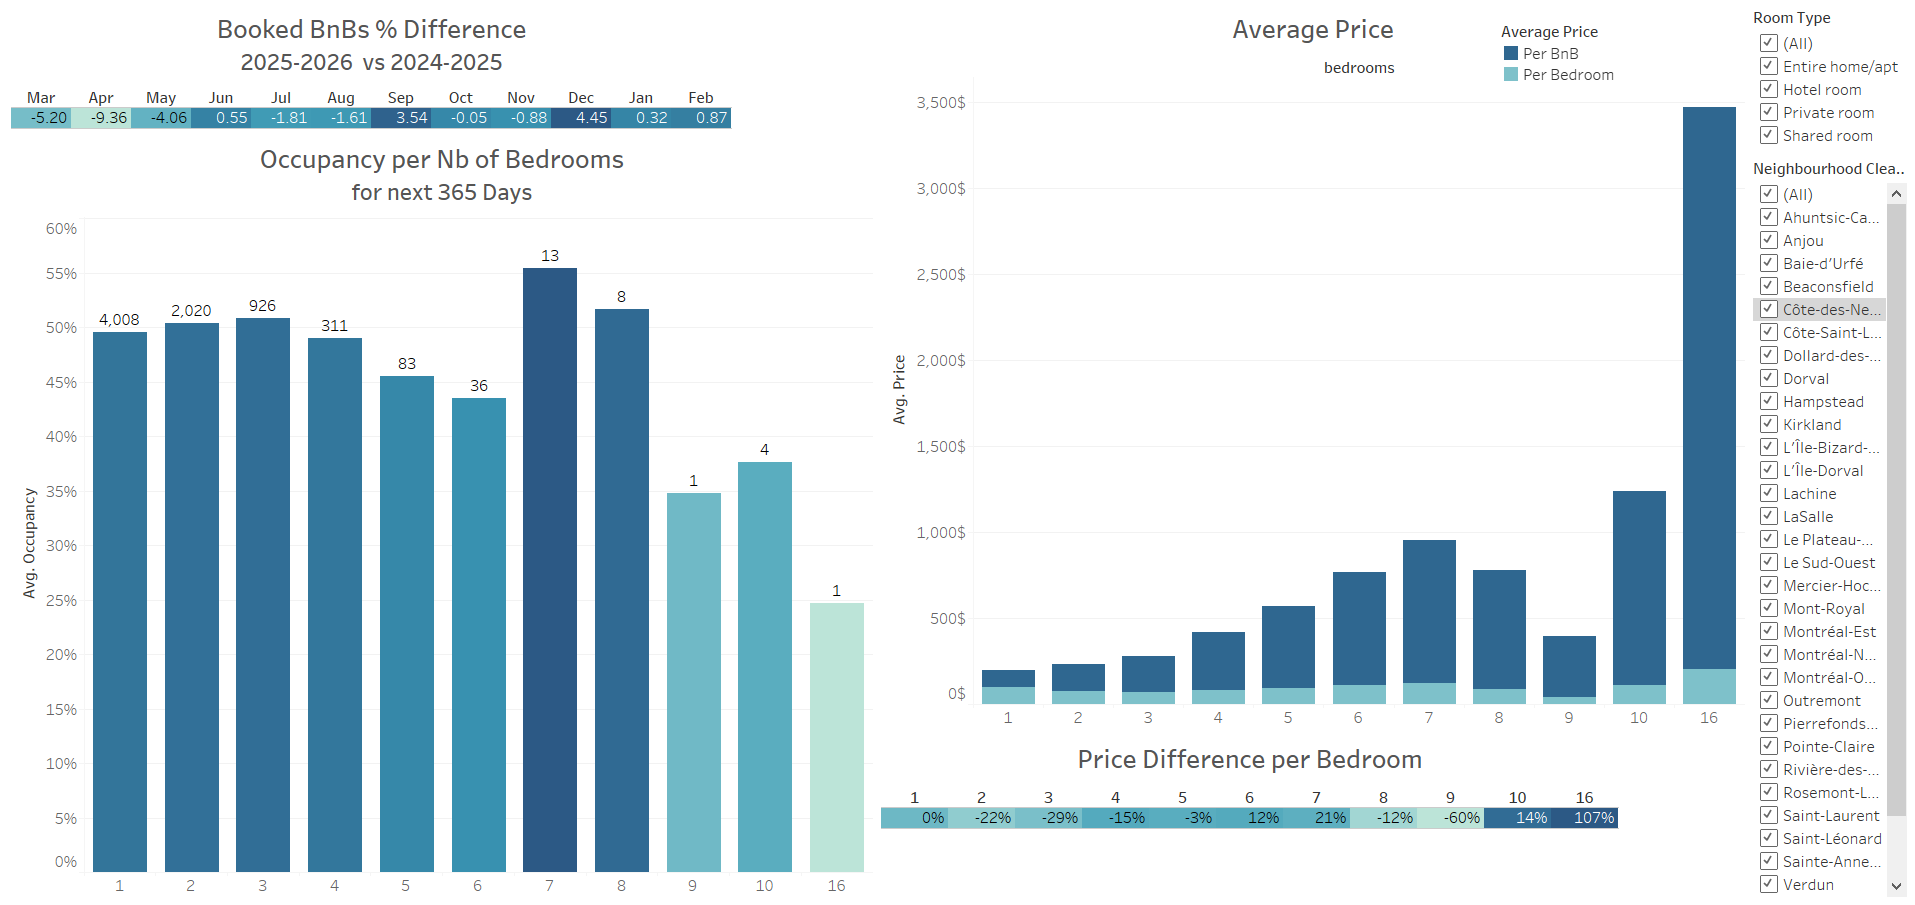
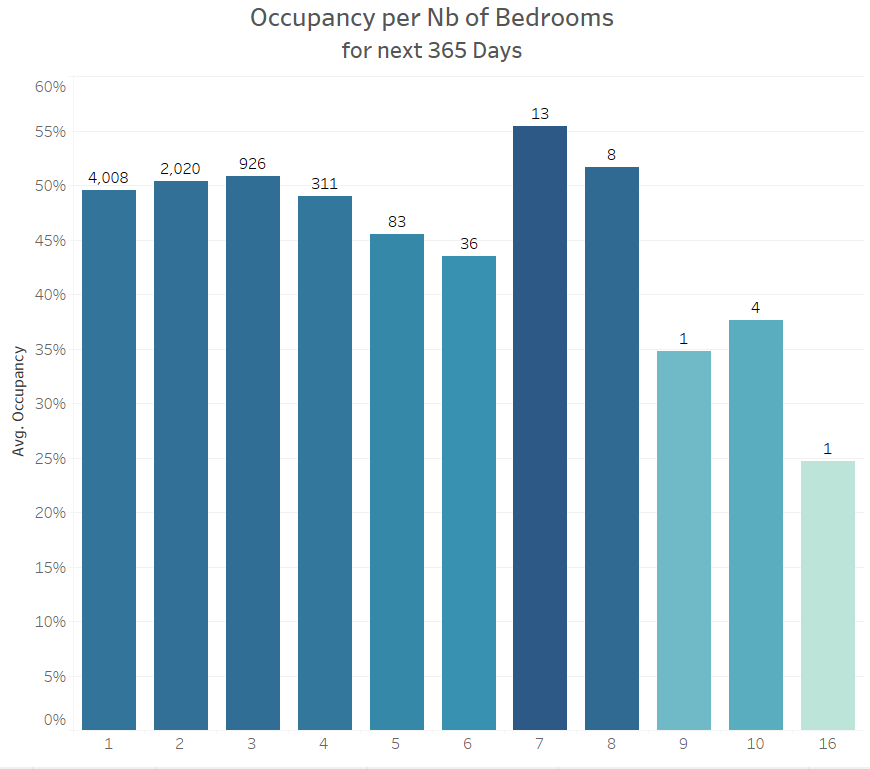
- Properties with one to three bedrooms account for 94% of listings, with three-bedroom units showing slightly stronger demand.
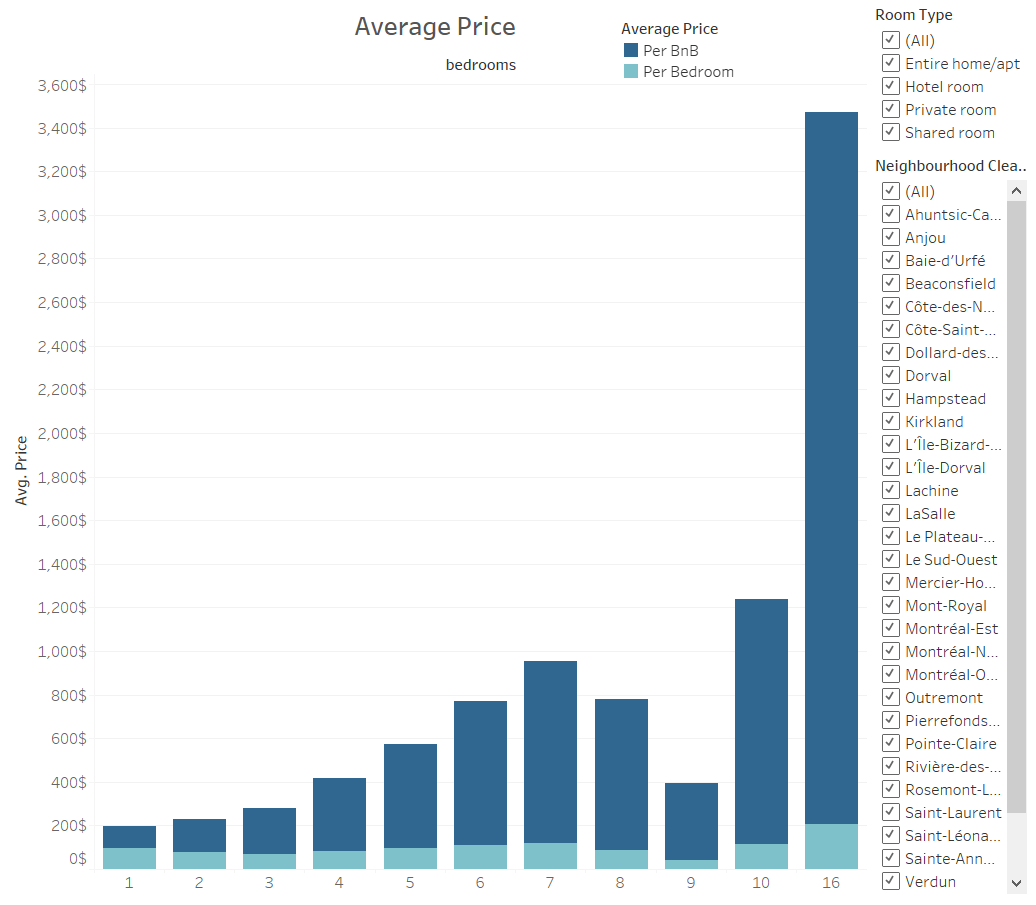
- Pricing analysis suggests that larger properties become increasingly expensive on a per-bedroom basis after the three-bedroom segment.
Insights deep-dive
Instant Book Feature
Listings with the Instant Book feature achieved approximately 6% higher occupancy and 4% more reviews while maintaining nearly identical ratings. Despite these benefits, the feature remains underutilized, with 1.24 times more hosts choosing not to enable it. This presents a potential opportunity for hosts looking to increase bookings with minimal risk to guest satisfaction.

Year-over-Year Growth
Bookings declined 18% between March and May 2025 compared to the previous year, with April recording the weakest performance. However, demand gradually recovered later in the year, with bookings increasing by 4-5% in September and December, suggesting a stronger outlook for the second half of the year.

Number of bedrooms
Properties with one to three bedrooms account for 94% of market supply. While one-bedroom listings are by far the most common, three-bedroom properties show slightly higher occupancy despite their lower availability. Listings with six or more bedrooms represent less than 1% of inventory and were excluded from the core analysis due to their limited sample size.
Pricing
Single-bedroom listings average $99 per night. The price per bedroom decreases as property size increases, reaching its lowest point among three-bedroom listings at roughly 30% below single-bedroom rates. Beyond three bedrooms, the price per bedroom rises again, ranging from 12% to 21% above single-bedroom rates for six to seven bedroom properties.

Key Insights
- 15% YoY decline in bookings
- Instant Book associated with 6% higher occupancy
- 94% of supply concentrated in 1-3 bedroom properties
- Three-bedroom listings show strongest occupancy relative to supply
- Pricing per bedroom lowest in the 3-bedroom segment
Recommendations
-
Help hosts quickly boost their occupancy: Encourage hosts to enable Instant Book, as listings using the feature demonstrate higher occupancy rates and review volume with little impact on guest ratings.
-
Highlight the listings most in demand : Highlight the strong demand for three-bedroom properties and encourage eligible hosts to market additional sleeping capacity where feasible. Note: The main target audience in the Greater Montreal are hosts with one to three bedrooms. I recommend personalizing the data with this range in mind.
-
Refine key financial data to empower hosts: Offer comparative data in terms of pricing per number of bedroom in their neighbourhood and Great Montreal. This will enable hosts further their knowledge of the current market and optimize their listings in terms of bookings and profits.
Limitations & Future Enhancements
Data Limitations
- Airbnb calendar data does not distinguish between booked nights and manually blocked dates, making occupancy an estimate rather than a direct measure.
- The two snapshots overlap by 16 days, and March 2026 contains incomplete data, which may slightly affect year-over-year comparisons. Additionally, the analysis is based on approximately two years of data and should therefore be interpreted as a reflection of recent market trends rather than long-term patterns.
- Listings with six or more bedrooms represent less than 1% of inventory and were excluded from the core analysis due to limited sample size.
Dataset
Inside Airbnb (https://insideairbnb.com/get-the-data/)
- Montreal snapshots:
- March 23, 2024
- March 6, 2025